“Relevance Lab celebrates successful completion of 5 years since inception. It is a real proud moment since the start in 2011 with a handful of passionate team members and a dream to pursue a journey. With a presence in US, India and Singapore the company now has a global footprint, a prestigious customer base, about 300 employees, key partnerships and strong investors. The opportunity of disruption with Cloud, DevOps and Automation is rapidly shaking the 100+ B$ market of incumbents and creating opportunities for niche Software-Defined companies. Relevance Lab with its unique positioning of Product + Services offers platform driven approach with significant advantages against traditional headcount driven services. The key focus on Automation, Optimization and Intelligent Systems is helping win large and transformational deals with a very healthy foundation. The company is focused for next 5 years to emerge as a dominant player helping enterprises transforming their Application Management, Infrastructure Management and Service Operations leveraging RLCatalyst, Cloud (IAAS, PAAS, SAAS Models) and Automation.”
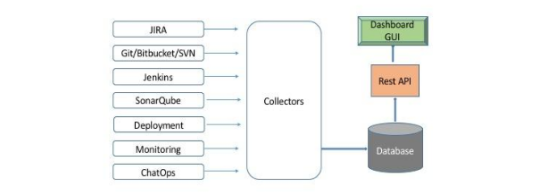
When multiple teams and resources are involved in development and operations, getting a clear cut picture on what is happening where is not easy. Though there are many tools like JIRA, Jenkins etc that gives its own unique dashboard, there is no single consolidated dashboard that gives the end-to-end delivery pipeline view. Collecting DevOps statistics from various tools is a challenge and Catalyst has solved this using its dashboard framework, that gives a 360 degree view of development, QA, Continuous Integration and deployment.
The framework has a highly flexible and configurable GUI, where widgets can be configured for different data sources/tools. The default view has multiple widgets for a team to get the 360 view of development and operations
Project management – JIRA
Commit – Github, Bitbucket and SVN
Build – Jenkins
Quality – Sonarqube
Deployment – Octopus, XLDeploy and Urbancode
Monitoring
ChatOps
Each one of these widget support multiple sources and one can configure any source according to the project needs. Dashboards can be configured at 2 levels
Team
Team level dashboards on story management, code commits, builds and deployment
Product or program view
Rolled up view for the product that involves multiple teams – shows flow of commit from dev to prod environments
How it works
The framework runs collectors for each data source that collects and stores data from each source at a predefined interval. The aggregation layer will read these data, convert into meaningful information and send to the GUI layer and charts through the REST API calls.
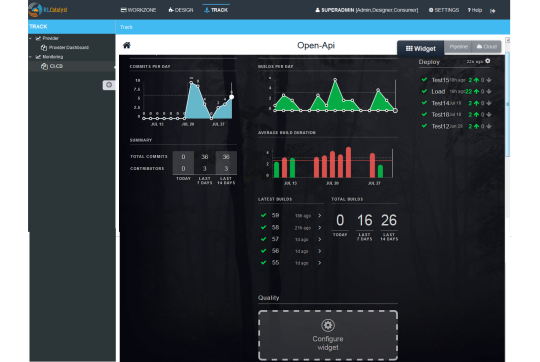
Once the teams dashboards are configured in the widgets, the data is automatically collected in the back-end and the display gets refreshed every minute.
The JIRA dashboard, the team can see the features that are being developed in the running sprint – The working progress and features that are done
The code repo shows coding activities – who has committed, the trends
The Build dashboard shows the details of last 5 builds, the status of each one of these and the trends
The Quality dashboard shows the code coverage, unit tests, security analysis etc.
Deployment dashboard shows the deployment details per environment.
The framework can be extended to support any type of DevOps tools
Pipeline View
The product dashboard gives a roll-up view of the entire product that may include multiple components of each – feature management, code repository, jobs etc. It shows the flow of commits from development to testing to production stages as a pipeline view with appropriate details of unit and functional testing. It also gives the trends on product health and performance.
We use cookies on our website to provide you with a more relevant experience. To learn more about how we use cookies and how you can manage your cookie settings, please refer to our Privacy.
We do not collect and sell your personal information.
This website uses cookies to improve your experience while you navigate through the website. Out of these, the cookies that are categorized as necessary are stored on your browser as they are essential for the working of basic functionalities of the website. We also use third-party cookies that help us analyze and understand how you use this website. These cookies will be stored in your browser only with your consent. You can opt-out of non-necessary cookies. But opting out of some of these cookies may affect your browsing experience.
Necessary cookies are absolutely essential for the website to function properly. This category only includes cookies that ensures basic functionalities and security features of the website. These cookies do not store any personal information.