Your address will show here +12 34 56 78
2022 Blog, Analytics, SPECTRA Blog, Blog, Featured

The Consumer Packaged Goods (CPG) Industry is one of the largest industries on the planet. From food and beverage to clothes to stationary, it is impossible to think of a moment in our lives without being touched or influenced by this sector. If there is one paradigm around which the industry revolves, regardless of the sub-sector or the geography, it is the fear of stock outs. Studies indicate that when a customer finds a product unavailable, 31% are likely to switch over to a competitor when it happens for the first time. It becomes 50% when this occurs for a second time and rises to 70% when this happens for a third time.

Historically, the panacea for this problem has been to overstock. While this reduced the risk of stock outs to a great extent, it induced a high cost for holding the inventory and increased risk of obsolescence. It also created a shortage of working capital since a part of it is always locked away in holding excess inventory. This additional cost is often passed on to the end customer. Over time, an integrated planning solution which could predict demand, supply and inventory positions became a key differentiator in the CPG industry since it helped rein in costs and become competitive in an industry which is extremely price sensitive.

Although theoretically, a planning solution should have been able to solve the inventory puzzle, practically, a lot of challenges kept limiting its efficacy. Conventional planning solutions have been built based on local planning practices. Such planning solutions have had challenges negotiating the complex demand patterns of the customers which are influenced by general consumer behaviour and also seasonal trends in the global market. As a result the excess inventory problem stays, which gets exacerbated at times due to bullwhip effect.

This is where the importance of a global integrated Production Sales Inventory (PSI) solutions comes in. But usually, this is easier said than done. Large organizations face multiple practical challenges when they attempt to implement this. Following are the typical challenges that large organizations face


  • Infrastructural Limitations
    Using conventional systems of Business Intelligence of Planning systems would require very heavy investment in infrastructure and systems. Also the results may not be proportionate to the investments made.
  • Data Silos
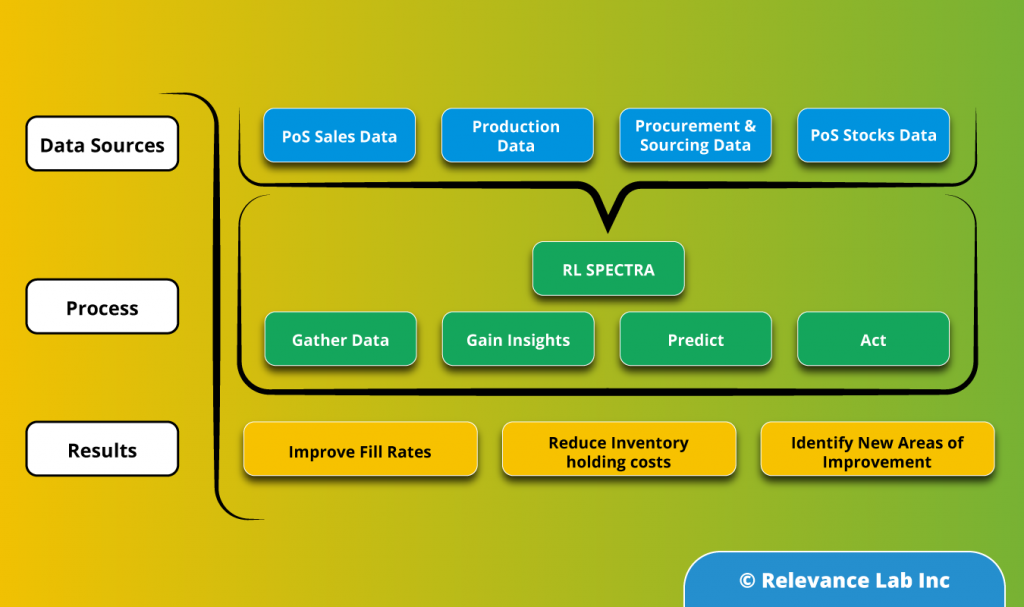
    PSI requires data from different departments including sales, production, and procurement/sourcing. Even if the organization has a common ERP, the processes and practices in each department might make it difficult to combine data and get insights.
    Another significant hurdle is the fact that larger organizations usually tend to have multiple ERPs for handling local transactions aligned to geographical markets. Each ERP or data source which does not talk to other systems becomes siloed. The complexities increase when the data formats and tables are incompatible, especially, when the ERPs are from different vendors.
  • Manual Effort
    Harmonizing the data from multiple systems and making them coherent involves a huge manual effort in designing, building, testing and deployment if we follow conventional mode. The prohibitive costs involved, not to mention the human effort involved is a huge challenge for most organizations.

Relevance Lab has helped multiple customers tide over the above challenges and get a faster return on their investments.

Here are the steps we follow to achieve a responsive global supply chain

  • Gather Data: Collate data from all relevant systems
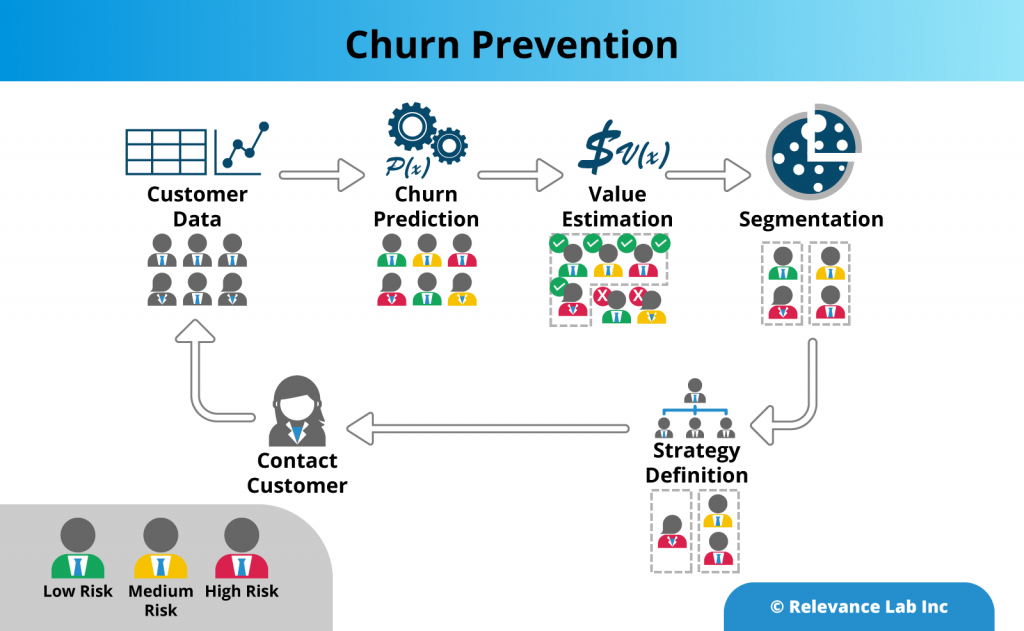
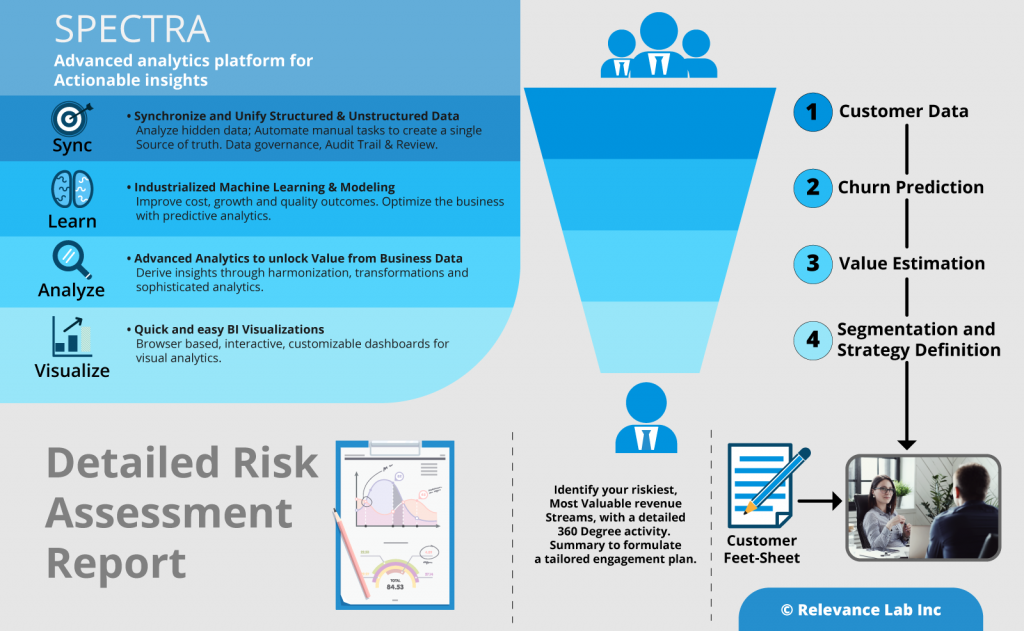
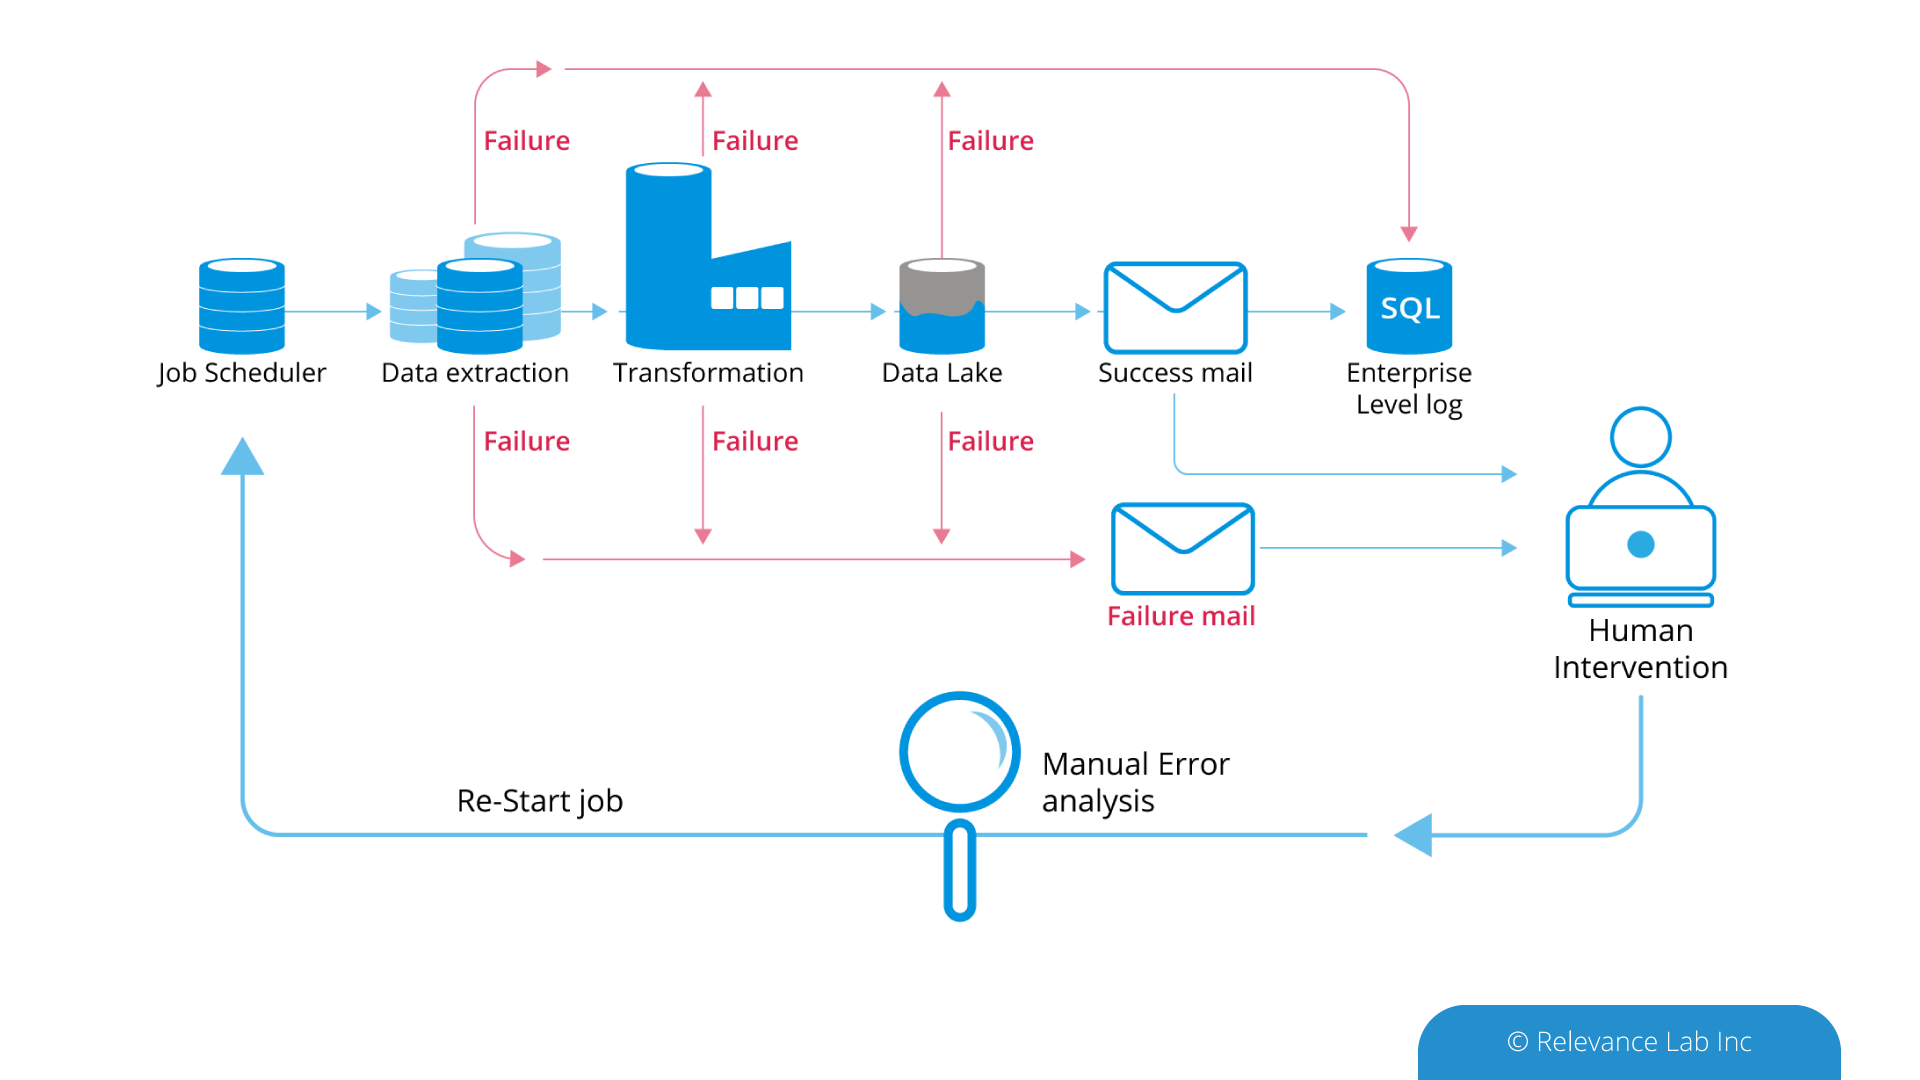
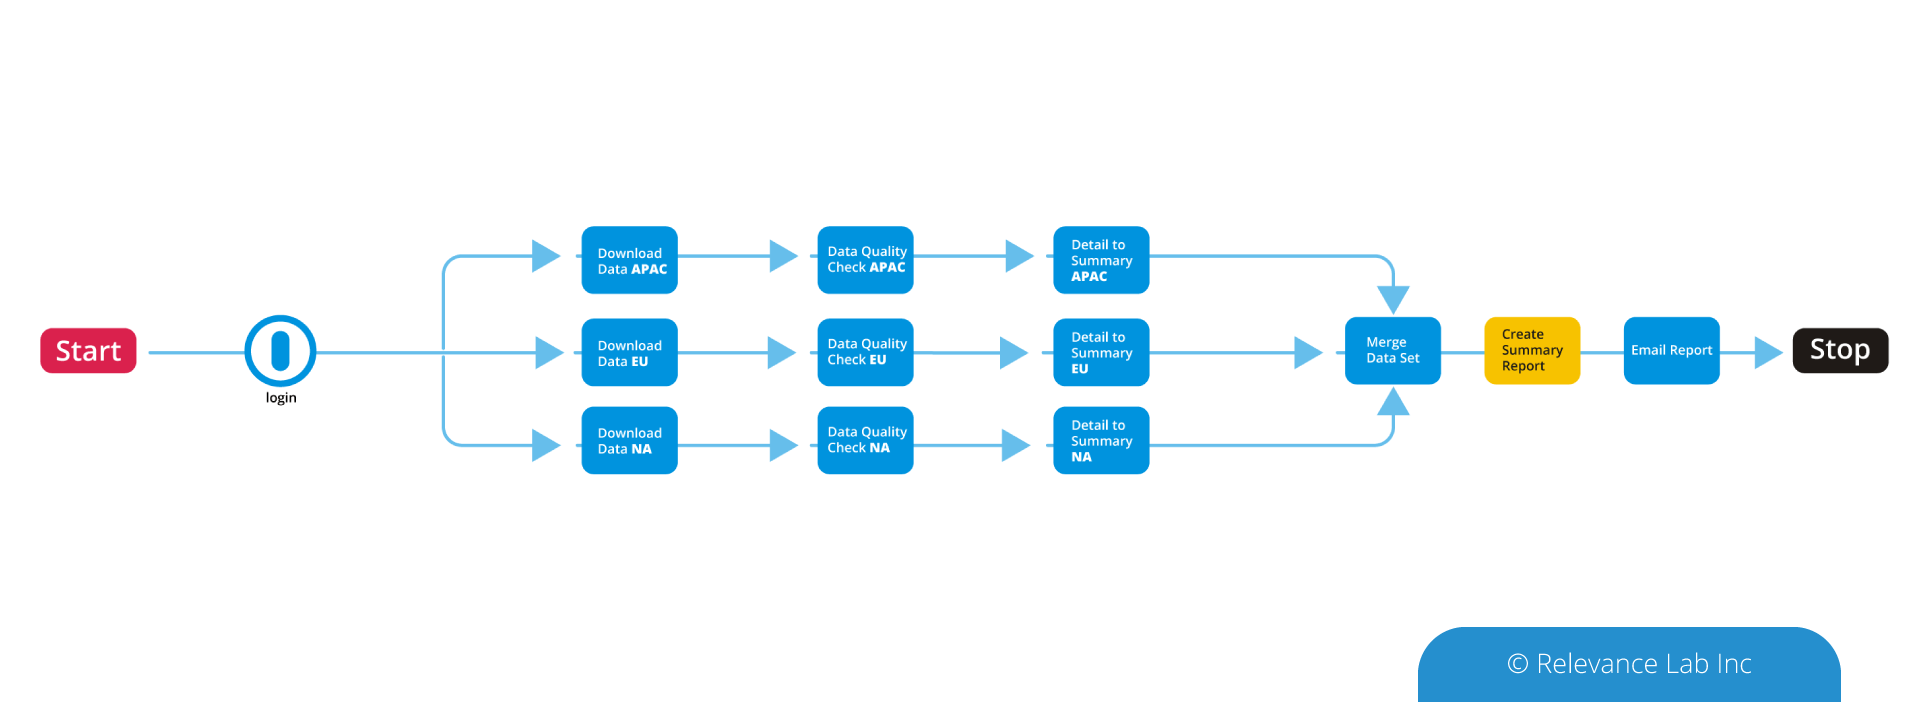
    Leveraging data from as many relevant sources (both internal and external) as possible is one of the most important steps in ensuring a responsive global supply chain. The challenge of handling the huge data volume is addressed through the use of big data technologies. The data gathered is then cleansed and harmonized using SPECTRA, Relevancelab big data/analytics platform. SPECTRA can then combine the relevant data from multiple sources, and refresh the results at specified periodic intervals. One point of note here is that Master Data harmonization, that usually consumes months of effort can be significantly accelerated with the SPECTRA’s machine learning and NLP capabilities.

  • Gain Insights: Know the as-is states from intuitive visualizations
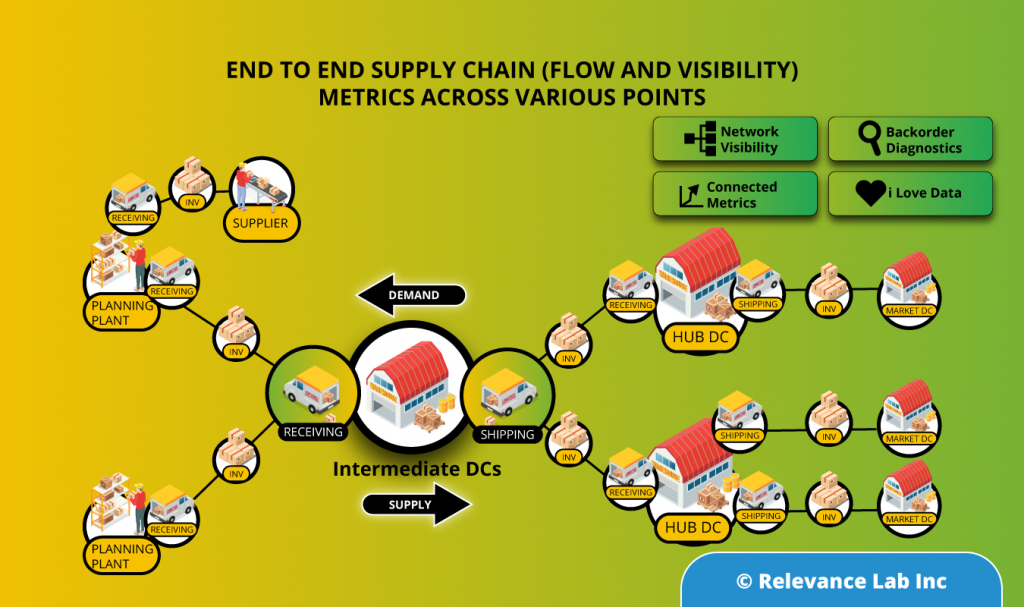
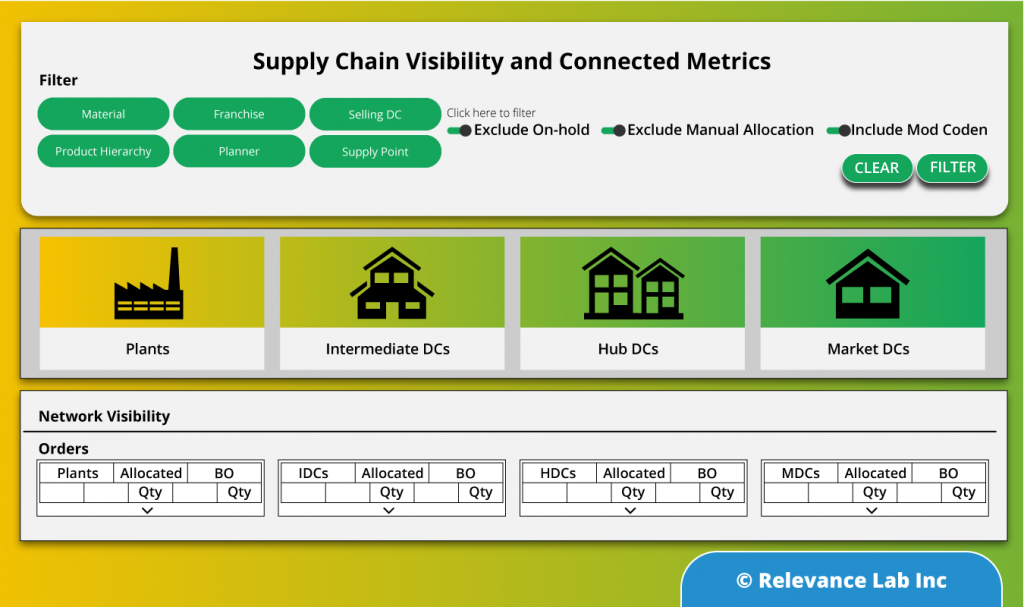
    The data pulled in from various sources can be combined to see the snapshot of inventory levels across the supply chain. SPECTRA’s built-in data models and quasi plug and play visualizations ensure that users get a quick and accurate picture of their supply chain. Starting with a bird’s eye view of the current inventory levels across various types of stocking locations and across each inventory type, the visualization capabilities of SPECTRA can be leveraged to have a granular view of the current inventory positions or backlog orders or compare sales with the forecasts. This a critical step in the overall process as this helps organizations to clearly define their problems and identify likely end states. For example, the organization could go for a deeper analysis to identify slow moving and obsolete inventory or fine tune their planning parameters.

  • Predict: Use big data to predict inventory levels
    The data from various systems can be used to predict the likely inventory levels based on service level targets, demand predictions, production and procurement information. Time series analysis is used to predict the lead time for production and procurement. Projected inventory level calculations for future days/weeks, thus calculated, is more likely to reflect the actual inventory levels since the uncertainties, both external and internal, have been well accounted for.

  • Act: Measurement and Continuous Improvement
    Inventory management is a continuous process. The above steps would provide a framework for measuring and tracking the performance of the inventory management solution and make necessary course corrections based on real time feedback.

Conclusion
Successful inventory management is one of the basic requirements for financial success for companies in the Consumer Packaged Goods Sector. There is no perfect solution to achieve this as the customer needs and environment are dynamic and the optimal solution could only be reached iteratively. Relevancelab framework to address inventory management combining deep domain experience with SPECTRA’s capabilities like NLP for faster master data management & harmonization, pre-built data models, quasi plug and play visualizations and custom algorithms offer a faster turn-around and quicker Return-on-Investment. Additionally, the comprehensive process ensures that the data is massaged and prepped for both broader and deeper analysis of the supply chain and risk in the future.

Additional references
https://www.2flow.ie/news-and-blog/solving-the-out-of-stock-problem-infographic

To learn how you can leverage ML and AI within your customer retention strategy, please reach out to marketing@relevancelab.com


0

2022 Blog, Analytics, SPECTRA Blog, Blog, Featured

If you are a business with a digital product or a subscription model, then you are already familiar with this key metric – “Customer Churn”.

Customer Churn is the percentage of customers who stopped using your product during a given period. This is a critical metric, as it not only reflects customer satisfaction but it also has a big impact on your bottom line. A common rule of the thumb is that it costs 6-7 times to get a new customer versus keeping the customers you already have. In addition, existing customers are expected to spend more over time, and satisfied customers lead to additional sales through referrals. Market studies show that increasing customer retention by small percentage can boost revenues significantly. Further research reveals that most professionals consider that Churn is just as or more important a metric than new customer acquisitions.

Subscription businesses strongly believe customers cancel for reasons that could be managed or fixed. “Customer Retention” is the set of strategies and actions that a company follows to keep existing customers from churning. Employing a data-driven customer retention strategy, and leveraging the power of big data and machine learning, offer significant opportunities for businesses to create a competitive advantage versus their peers that don’t.

Relevance Lab (RL) recently helped a large US based Digital learning company benefit from a detailed churn analysis of its subscription customers, by leveraging the RL SPECTRA platform with machine learning. The portfolio included several digital subscription products used in school educational curriculums which are renewed annually during the start of the school calendar year. Each year, there were several customers that did not renew their licenses and importantly, this happened at the end of the subscription cycle; typically too late for the sales team to respond effectively.

Here are the steps that the organisation took along the churn management journey.


  • Gather multiple data points to generate better insights
    As with any analysis, to figure out where your churn is coming from, you need to keep track of the right data. Especially with machine learning initiatives, the algorithms depend on large quantities of raw data to learn complex patterns. A sample list of data attributes could include online interactions with the product, clicks, page views, test scores, incident reports, payment information, etc, it could also include unstructured data elements such as reports, reviews and blog posts.

    In this particular example, the data was pulled from four different databases which contained the product platform data for our relevant geography. Data collected included product features, sales and renewal numbers, as well as student product usage, test performance statistics etc, going back to the past 4 years.

    Next, the data was cleansed to remove trial licenses, dummy tests etc, and to normalize missing data. Finally, the data was harmonized to bring all the information into a consolidated format.

    All the above pipelines were established using the SPECTRA ETL process. Now there was a fully functional data setup with cleaned data ordered in tables, to be used in the machine learning algorithms for churn prediction.

  • Predictive analytics use Machine Learning to know who is at risk
    Once you have the data, you are now ready to work on the core of your analysis, to understand where the risk of churn is coming from, and hence identify the opportunities for strengthening your customer relationships. Machine learning techniques are especially suited to this task, as they can churn massive amounts of historical data to learn about customer behavior, and then use this training to make predictions about important outcomes such as retention.

    On our assignment, the RL team tried out a number of machine learning models built-in within SPECTRA to predict the churn and zeroed in on a random forest model. This method is very effective when using inconsistent data sets, where the system can handle differences in behavior very effectively by creating a large number of random trees. In the end, the system provided a predicted rating for each customer to drop out of the system and highlighted the ones most at risk.

  • Define the most valuable customers
    Parallel to identifying customers at risk of churn, data can also be used to segment customers into different groups to identify how each group interacts with your product. In addition, data regarding frequency of purchase, purchase value, product coverage helps you to quickly identify which type of customers are driving the most revenue, versus customers which are a poor fit for your product. This will then allow you to adopt different communication and servicing strategies for each group, and to retain your most valuable customers.

    By combining our machine learning model output with the segmentation exercise, the result was a dynamic dashboard, which could be sorted/filtered by different criteria such as customer size and geographical location. This provided the opportunity to highlight the customers which were at the highest risk, from the joint viewpoint of attrition and revenue loss. This in turn enabled the client to effectively utilize sales team resources in the best possible manner.

  • Engage with the customers
    Now that you have identified your top customers who you are at risk of losing, the next step is to actively engage with them, to incentivise the customers to stay with you, by being able to help the customer achieve real value out of your product.

    The nature of engagement could depend on the stage the customer is in the relationship. Is the customer in the early stage of product adoption? This could then point to the fact that the customer is unable to get set up with your product. Here, you have to make sure that the customer has access to enough training material, maybe the customer requires additional onboarding support.

    If the customer is in the middle stage, it could be that the customer is not realizing enough business value out of your product. Here, you need to check in with your customer, to see whether they are making enough progress towards their goals. If the customer is in late stage, it is possible that they are looking at competitor offerings, or they were frustrated with bugs, and hence the discussion would need to be shaped accordingly.

    To tailor the nature of your conversation, you need to take a close look at the customer product interaction metrics. In our example, all the customer usage patterns, test performance, books read, word literacy, etc, were collected and presented as a dashboard, as a single point of reference for the sales and marketing team to easily review customer engagement levels, to be able to connect constructively with the customer management.


Conclusion
If you are looking at reducing your customer churn and improving customer retention, it all comes down to predicting customers at risk of churn, analyzing the reasons behind churn, and then taking appropriate action. Machine learning based models are of particular help here, as they can take into account hundreds and even thousands of different factors, which may not be obvious or even possible to track for a human analyst. In this example, the SPECTRA platform helped the client sales team to predict the customers’ inclination for renewal of the specific learning product with 92% accuracy.

Additional references
Research from Bain and Co. shows that increasing customer retention by even 5% boosts revenues by 25% – 95%
Reportfrom Brightback reveals Churn is just as or more important a metric than new customer acquisitions

To learn how you can leverage machine learning and AI within your customer retention strategy, please reach out to marketing@relevancelab.com


0

2022 Blog, Analytics, Blog, Featured

Nobody likes remembering credentials. They appear like exerting plenty of pressure on the memory. What is worse is many use identical username and password, no matter the application they are using. Single Sign-On (SSO) could be a method of authentication that permits websites to use other trustworthy sites to verify users. Single Sign-On allows a user to log into any independent application with one ID and password. Verification of user identity is very important when it involves knowing which permissions a user will have. OKTA is a leading IDAM application that our client uses for managing access that blends user identity management solutions with SSO solutions. SPECTRA, an analytical platform which is supported by open source technology has recently been on boarded for the client who is into publishing space. The client has integrated all their applications under one roof of IDAM (OKTA). SPECTRA also follows the same route.

What is SPECTRA?
SPECTRA is a Big Data Analytics platform from Relevance Lab, which has the ability to consume, store and process structured and unstructured data. It also can cleanse and integrate this data into one unique platform. It depicts data intelligently and presents it using an intuitive visualization layer so that business users can get actionable business insights across various parameters. Coupled with an OCR engine, it also provides Google-like search capabilities across legacy unstructured and structured data.


SAML
In the modern era of computing, security is an essential feature when it comes to enterprise applications. Security Assertion Markup Language (SAML) is used to provide a single point of authentication at a secure identity provider. This feature highlights that user credentials could not leave the firewall boundary. SAML is used to assert the identity to others.

SAML SSO works by transferring the user’s identity from one place (OKTA) to another service provider(SPECTRA). The application identifies the user’s origin (By First Name, Last Name & Network Email ID) and redirects the user back to the identity provider (OKTA), asking for authentication to enter the IdP registered credentials.

See the high level architectural diagram below.


Integrating with OKTA Idam Platform using SAML
Identity Provider (IdP) is an entity that provides the identities, including the flexibility to authenticate a user-agent. The Identity Provider also contains the additional user profile information like name, last name, job code, signal, address, and so on. Several service providers may require a simple user profile, while others may require a complex set of user data (job code, department, address, location, manager, etc).

See the diagram below which show Spectra and SAML Integration.


SAML Request, also referred to as an authentication request, is generated by the SPECTRA (Service Provider) to “request” an authentication through IdP to User-Agent. SAML Response is generated by the Identity Provider. It contains the accurate assertion of the authenticated user. Additionally, a SAML Response also contains additional information, like user profile information and group/role information, betting on what the Service Provider can support.

See the picture below which shows SAML Integration flow.


SPECTRA platform initiates sign-in describes the SAML sign-in flow when initiated by the Service Provider. This is triggered when the end-user tries to access a resource or log-in directly on the Service Provider side, like when the user-agent (browser) tries to access a protected resource on the Service Provider side.

An Identity Provider (Idp) initiates sign-in depicts the SAML sign-in request created by the Identity Provider. The Idp initiates a SAML Response that is redirected to the Service Provider to confirm the user’s identity, rather than the SAML flow being triggered by a redirection from the SPECTRA. The Service Provider not once directly interacts with the Identity Provider. User-Agent (browser) functions as the agent to carry out all the redirections. The Service Provider must know which Idp to pass on to the MySQL database. The Service Provider must authenticate the user until the SAML assertion comes back from the Idp.

An Identity Provider can initiate an authentication flow. The SAML authentication flow is asynchronous. The Service Provider interacts with Idp and redirects the request to the complete flow. This creates a situation where the Service Provider will not maintain any state of authentication requests. The response that Service Provider gets from an Identity Provider must contain all the required information. SPECTRA validate the OKTA user information in MySQL DB and transfer the assigned user roles in the application. User can view the assigned roles within the application.

SPECTRA, a product from Relevance Lab offers great flexibility as an analytical platform that has ability to consume, store and process structured and unstructured data. It can be integrated with various Identity Access Management platforms like OneLogin, AuthO, Ping Identity, etc using SAML.

For more details, please feel free to reach out to marketing@relevancelab.com


0

2020 Blog, Analytics, command blog, Blog, Featured

Automation with simple scripts is relatively easy, but complexity creeps in to solve real-world production-grade solutions. A compelling use case was shared with us by our large Financial Asset management customer. They deal with this customer who provides a large number of properties & financial data feeds with multiple data formats coming in different frequencies ranging from daily, weekly, monthly and ad-hoc. The customer business model is driven based on Data processing on these feeds and creating “data-pipelines” for ingestion, cleansing, aggregation, analysis, and decisions from their Enterprise Data Lake.


The current Eco-System of customer comprises multiple ETL Jobs, which connects to various internal, external systems and converts into a Data Lake for further data processing. The complexity was enormous as the volume of data was high and lead to high chances of failures and indeed required continuous human interventions and monitoring of these jobs. Support teams receive a notification through emails when a job is only completed successfully or on failure. Thus, the legacy system makes job monitoring and exception handling quite tricky. The following simple pictorial representation explains a typical daily Data Pipeline and associated challenges:


The legacy solution has multiple custom scripts implemented in Shell, Python, Powershell that would make a call to Azure Data Factory via an API call to run a pipeline. Each independent task had its complexities, and there was a lack of an end to end view with real-time monitoring and error diagnostics.


A new workflow model was developed using the RLCatalyst workflow monitoring component, (using YAML definitions) and the existing customer scripts were converted to RLCatalyst BOTs using a simple migration designer. Once loaded into RLCatalyst Command Centre, the solution provides a real-time and historical view with notifications to support teams for anomaly situations and ability to take auto-remediation steps based on configured rules.


We deployed the entire solution in just three weeks in the customer’s Azure environment along with migrating the existing scripts.


RLCatalyst Workflow Monitoring provides a simple and effective solution much different from the standard RPA tools. RPA deals with more End-User Processing workflows while RLCatalyst Workflow Monitoring is more relevant for Machine Data Processing Workflows and Jobs.


For more information feel free to contact marketing@relevancelab.com


0