2021 Blog, command blog, Blog, Featured
Automated Insights to your Application using AWS X-Ray
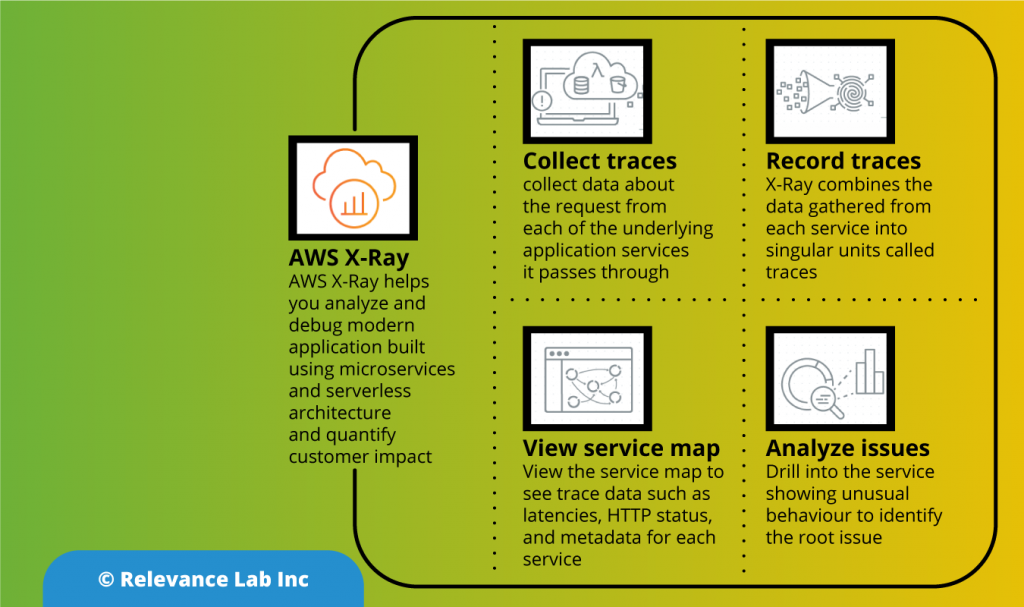
AWS X-Ray is an application performance service that collects data about requests that your application processes, and provides tools to view, filter, and gain insights into that data to identify issues and opportunities for optimization. It enables a developer to create a service map that displays an application’s architecture. For any traced request to your application, you can see detailed information not only about the request and response, but also about calls that your application makes to downstream AWS resources, microservices, databases and HTTP web APIs. It is compatible with microservices and serverless based applications.
The X-Ray SDK provides
- Interceptors to add to your code to trace incoming HTTP requests
- Client handlers to instrument AWS SDK clients that your application uses to call other AWS services
- An HTTP client to use to instrument calls to other internal and external HTTP web services
The SDK also supports instrumenting calls to SQL databases, automatic AWS SDK client instrumentation, and other features.
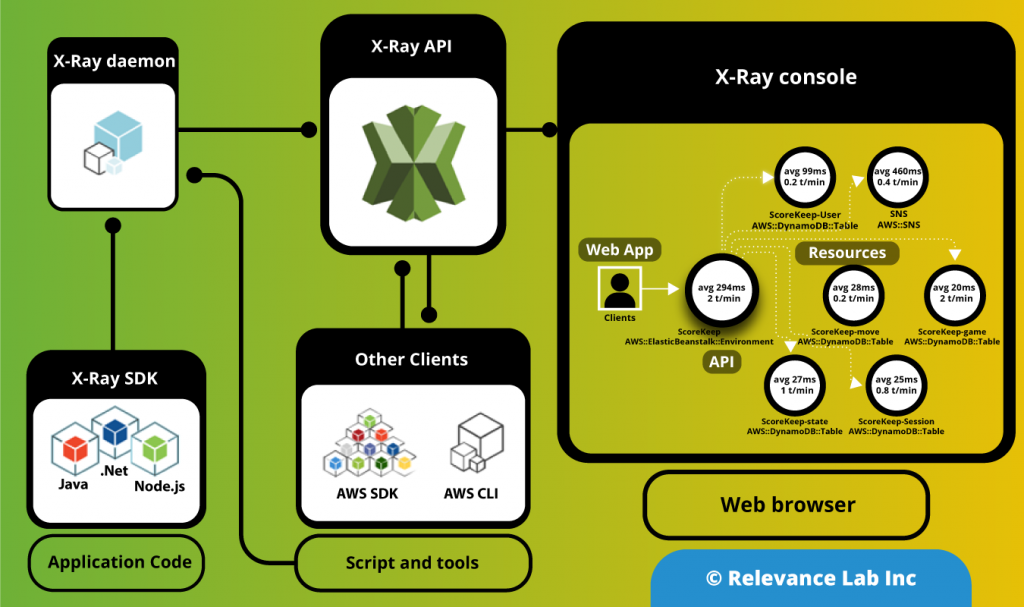
Instead of sending trace data directly to X-Ray, the SDK sends JSON segment documents to a daemon process listening for UDP traffic. The X-Ray daemon buffers segments in a queue and uploads them to X-Ray in batches. The daemon is available for Linux, Windows, and macOS, and is included on AWS Elastic Beanstalk and AWS Lambda platforms.
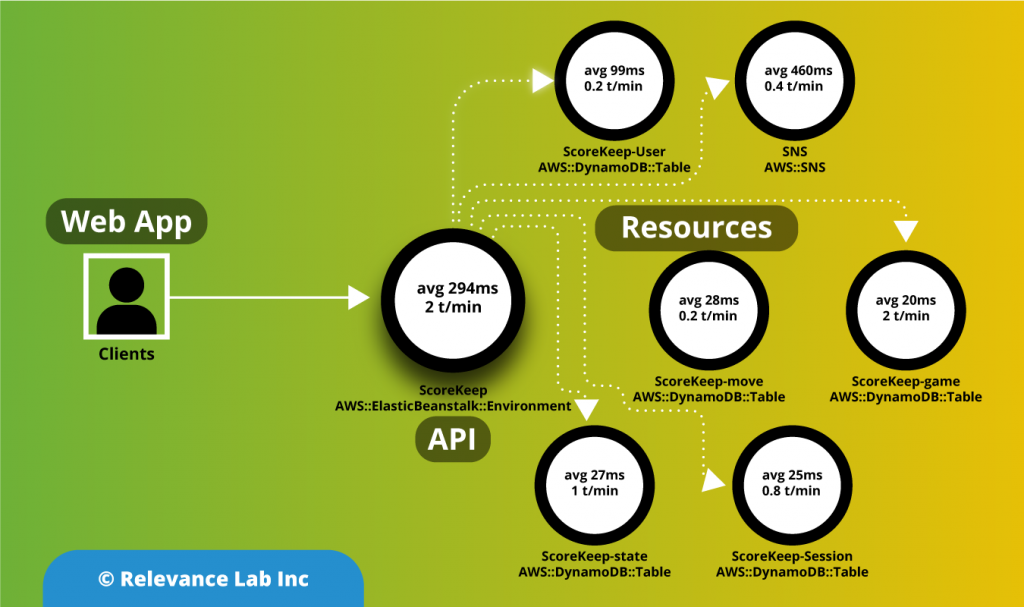
X-Ray uses trace data from the AWS resources that power your cloud applications to generate a detailed service graph. The service graph shows the client, your front-end service, and corresponding backend services to process requests and persist data. Use the service graph to identify bottlenecks, latency spikes, and other issues to solve to improve the performance of your applications.
AWS X-Ray Analytics helps you quickly and easily understand
- Any latency degradation or increase in error or fault rates
- The latency experienced by customers in the 50th, 90th, and 95th percentiles
- The root cause of the issue at hand
- End users who are impacted, and by how much
- Comparisons of trends based on different criteria. For example, you could understand if new deployments caused a regression
How AWS X-Ray Works
AWS X-Ray receives data from services as segments. X-Ray groups the segments that have a Common request into traces. X-Ray processes the traces to generate a service map which provides a visual depiction of the application
AWS X-Ray features
- Simple setup
- End-to-end tracing
- AWS Service and Database Integrations
- Support for Multiple Languages
- Request Sampling
- Service map
Benefits of Using AWS X-Ray
Review Request Behaviour
AWS X-Ray traces customers’ requests and accumulates the information generated by the individual resources and services, which makes up your application, granting you an end-to-end view on the actions and performance of your application.
Discover Application Issues
Having AWS X-Ray, you could extract insights about your application performance and finding out root causes. As AWS X-Ray is having tracing features, you can easily follow request paths to diagnose where in your application and what is creating performance issues.
Improve Application Performance
AWS X-Ray’s service maps allow you to see connection between resources and services in your application in actual time. You could simply notice where high latencies are visualizing node, occurring and edge latency distribution for services, and after that, drilling down into the different services and paths having impact on the application performance.
Ready to use with AWS
AWS X-Ray operates with Amazon EC2 Container Service, Amazon EC2, AWS Elastic Beanstalk, and AWS Lambda. You could utilize AWS X-Ray with applications composed in Node.js, Java, and .NET, which are used on these services.
Designed for a Variety of Applications
AWS X-Ray operates for both simple and complicated applications, either in production or in development. With X-Ray, you can simply trace down the requests which are made to the applications that span various AWS Regions, AWS accounts, and Availability Zones.
Why AWS X-Ray?
Developers spend a lot of time searching through application logs, service logs, metrics, and traces to understand performance bottlenecks and to pinpoint their root causes. Correlating this information to identify its impact on end users comes with its own challenges of mining the data and performing analysis. This adds to the triaging time when using a distributed microservices architecture, where the call passes through several microservices. To address these challenges, AWS launched AWS X-Ray Analytics.
X-Ray helps you analyze and debug distributed applications, such as those built using a microservices architecture. Using X-Ray, you can understand how your application and its underlying services are performing to identify and troubleshoot the root causes of performance issues and errors. It helps you debug and triage distributed applications wherever those applications are running, whether the architecture is serverless, containers, Amazon EC2, on-premises, or a mixture of all of these.
Relevance Lab is a specialist AWS partner and can help Organizations in implementing the monitoring and observability framework including AWS X-ray to ease the application management and help identify bugs pertaining to complex distributed workflows.
For a demo of the same, please click here
For more details, please feel free to reach out to marketing@relevancelab.com